DEVELOPER PLATFORM
System Status
The RapidCents status page reports real-time availability for payment processing, the gateway, webhooks, the dashboard and terminal connectivity, with incident history and subscribable updates. Components are reported separately on purpose, because the failure that costs money is rarely total: webhook delivery lagging while authorizations run normally looks fine on a single global indicator and is not fine in an order pipeline. An incident entry names what is affected, what is not, when it started and what has been established.
- Sandbox with documented test cards
- Signed webhooks
- Typed errors and idempotent retries
- Dedicated developer support

What crosses the wire
What is reported
One state per component rather than one for the platform, plus the incident open against it. Payment processing, the gateway, webhook delivery, the dashboard and terminal connectivity fail independently and are shown that way.
What an incident entry carries
What is affected, what is not, when it started, what has been established so far, and updates as they are confirmed rather than as they are guessed. The resolution note follows once the cause is understood.
What you should correlate it with
Your own error codes and request ids. An incident timeline plus your logs is what separates a platform event from a change you shipped an hour earlier and had forgotten about.
When to use it
During an incident
Confirm platform state before escalating an integration bug, and before rolling back a release that had nothing to do with it.
In due diligence
Incident history shows how issues are communicated and how quickly they are resolved, which is more informative than any single availability figure.
When writing your own runbook
Component granularity tells you which of your systems degrade together, and therefore which fallbacks are worth building.
How to implement System Status
Subscribe your on-call channel to status updates before you need them.
Check component status before opening a support ticket.
Correlate your error codes and request ids with the incident timeline.
Decide in advance what your application does when webhook delivery is degraded.
Review the post-incident note for any action required on your side.
What fails, and how you find out
Reading one indicator and stopping
A platform marked operational can still have one degraded component. Check the component your integration depends on, which for most applications is webhook delivery rather than authorization.
No plan for delayed events
If webhook delivery lags, payments still authorize and your orders still need updating. An application with no queue and no backfill query has no way to catch up once delivery resumes.
Escalating without evidence
A ticket saying payments are failing is slower to act on than one carrying request ids, error codes and a timestamp range. The status page tells you which of those support already knows about.
Alerting only on total failure
Most incidents show up in your metrics first, as a rising decline rate or a growing gap between payments created and events processed. Alert on those, and use status to explain what you already detected.
Sandbox versus production
Status covers production
The page reports the environment your customers are in. Sandbox availability is not the number an incident is measured against, so a sandbox failure during an incident is not evidence of scope.
Degradation is worth rehearsing in sandbox
You cannot schedule a production incident, but you can point a sandbox integration at a deliberately broken webhook endpoint and watch what your application does while events pile up.
The commitment is scoped
The gateway API carries a 99.9% uptime service level. Other components are reported on the status page on their own terms, and the incident history is the honest record of how each has behaved.
Questions about System Status
Where can I check whether RapidCents is down?
The status page reports each component separately: processing, gateway, webhooks, dashboard and terminals, so a partial degradation is visible rather than hidden behind one global indicator.
Can I subscribe to incident notifications?
Yes. Updates can be delivered to a team channel so on-call sees platform state without polling.
Is incident history retained?
Yes, with resolution notes, which is what due-diligence reviews usually ask for.
Is there an availability commitment I can point a procurement team at?
The gateway API carries a 99.9% uptime service level. Scope matters here: that figure covers the gateway API specifically, and the status page is the record for every other component.
What should my application do when webhook delivery is degraded?
Keep accepting payments, keep writing your own record from the synchronous response, and reconcile from the API once delivery resumes. Events are not lost during a delay, so the recovery is a backfill rather than a rebuild.
How do I tell a platform incident from a problem in my own code?
Check whether the affected component is reported as degraded, then check whether your failures started at a deploy boundary. If your errors predate the incident window, the incident is not your cause.
Does an incident automatically extend a deprecation window or a support clock?
No, and they are tracked separately. Deprecation dates come from the changelog and support commitments come from your tier; an incident affects neither, so raise both explicitly if they matter to you.
Should I alert on the status page or on my own metrics?
Your own metrics first. Most incidents show up as a rising decline rate or a growing gap between payments created and events processed before anything is posted. Use the status page to explain what your monitoring already detected, not to detect it.
Does the status page cover the sandbox?
No. It reports the environment customers are in, so a sandbox failure during an incident is not evidence of scope. Degradation is still worth rehearsing there: point a sandbox integration at a deliberately broken webhook endpoint and watch what your application does while events pile up.
Continue the integration
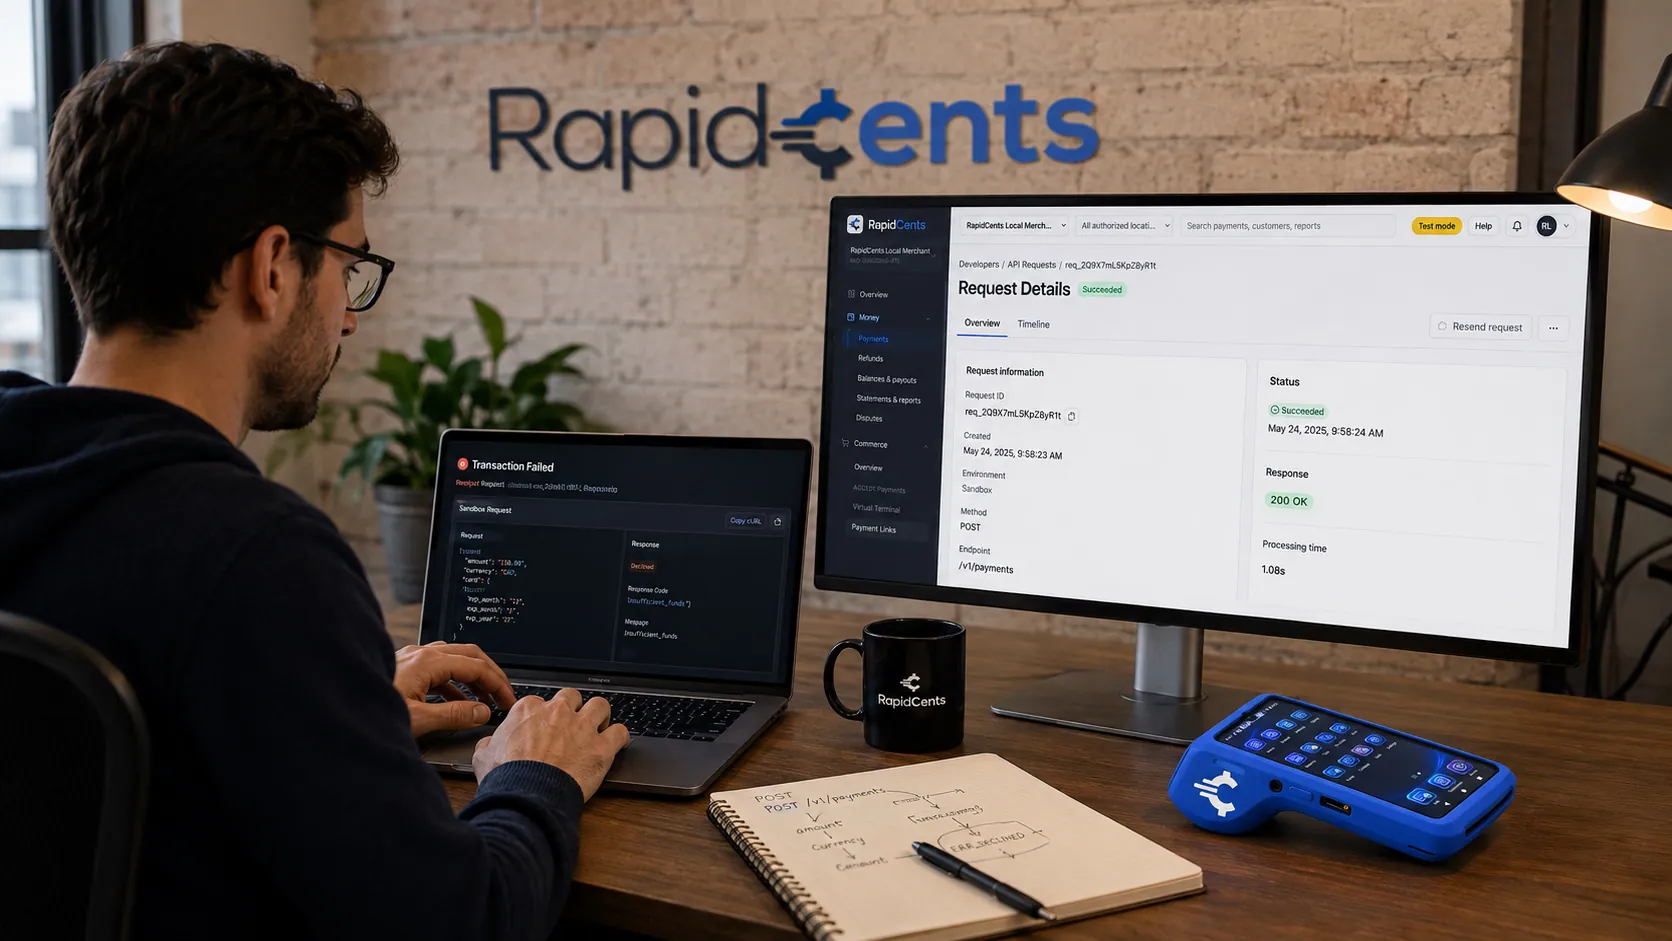
A RapidCents developer-support desk tracing a live payment request beside the merchant dashboard and a test terminal. Developer Support
Developer support channel with SLA tiers for production integrations.
Explore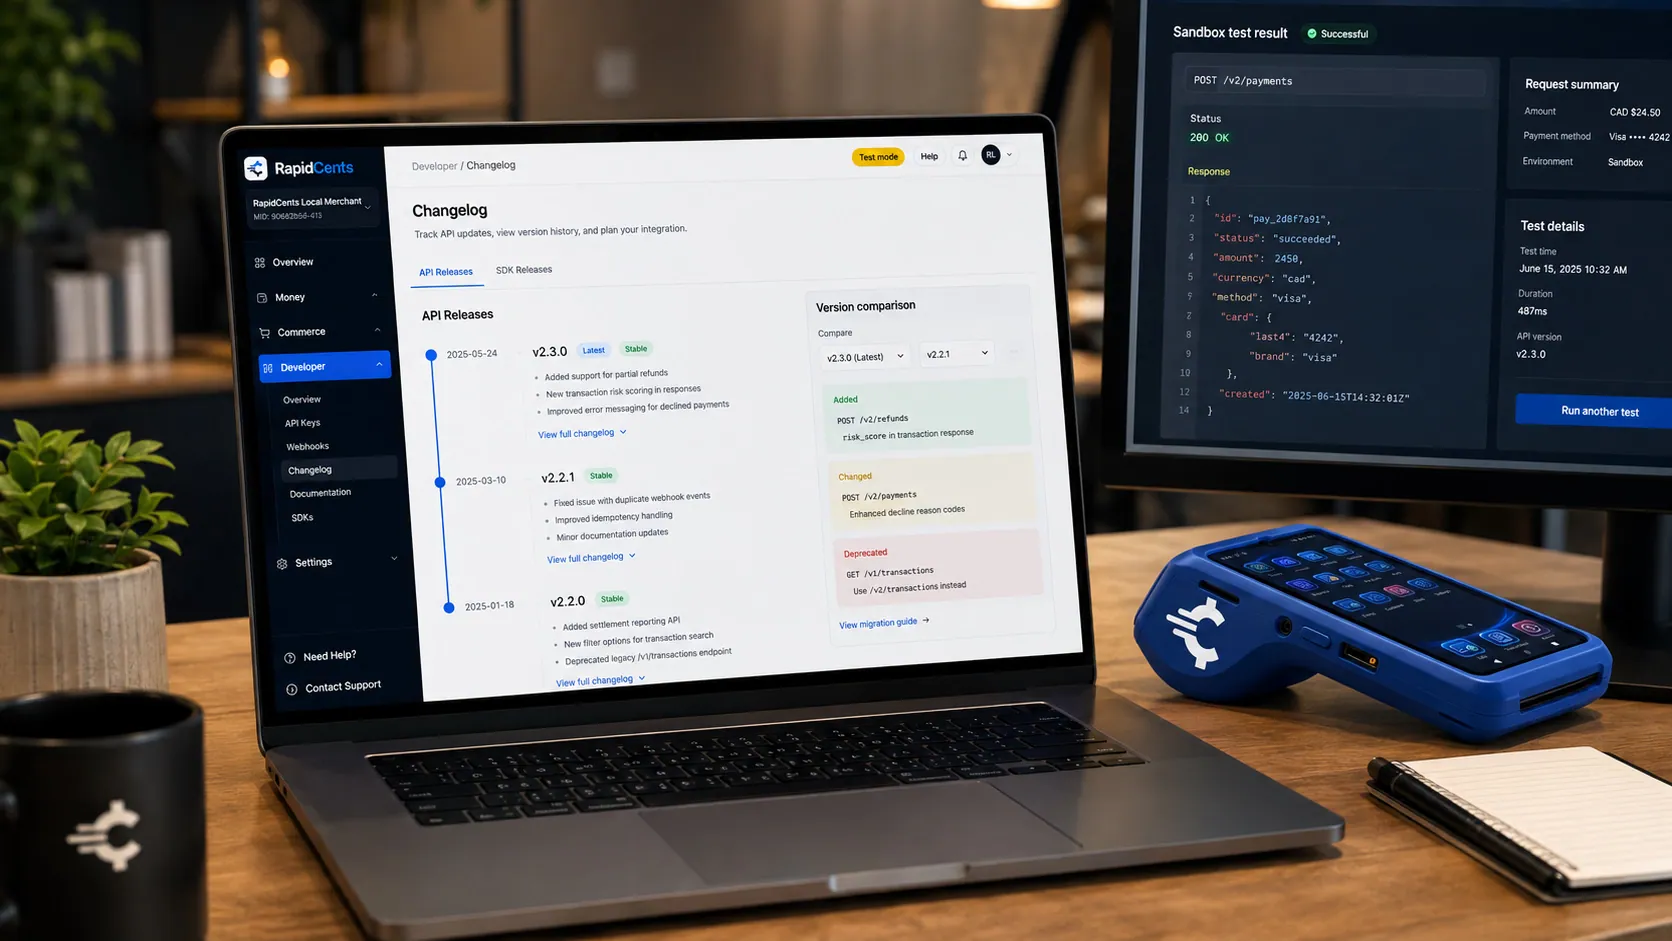
The RapidCents API changelog open beside a sandbox result and a test terminal, showing what changed in the latest release. Changelog
API version history, breaking changes and deprecation notices.
Explore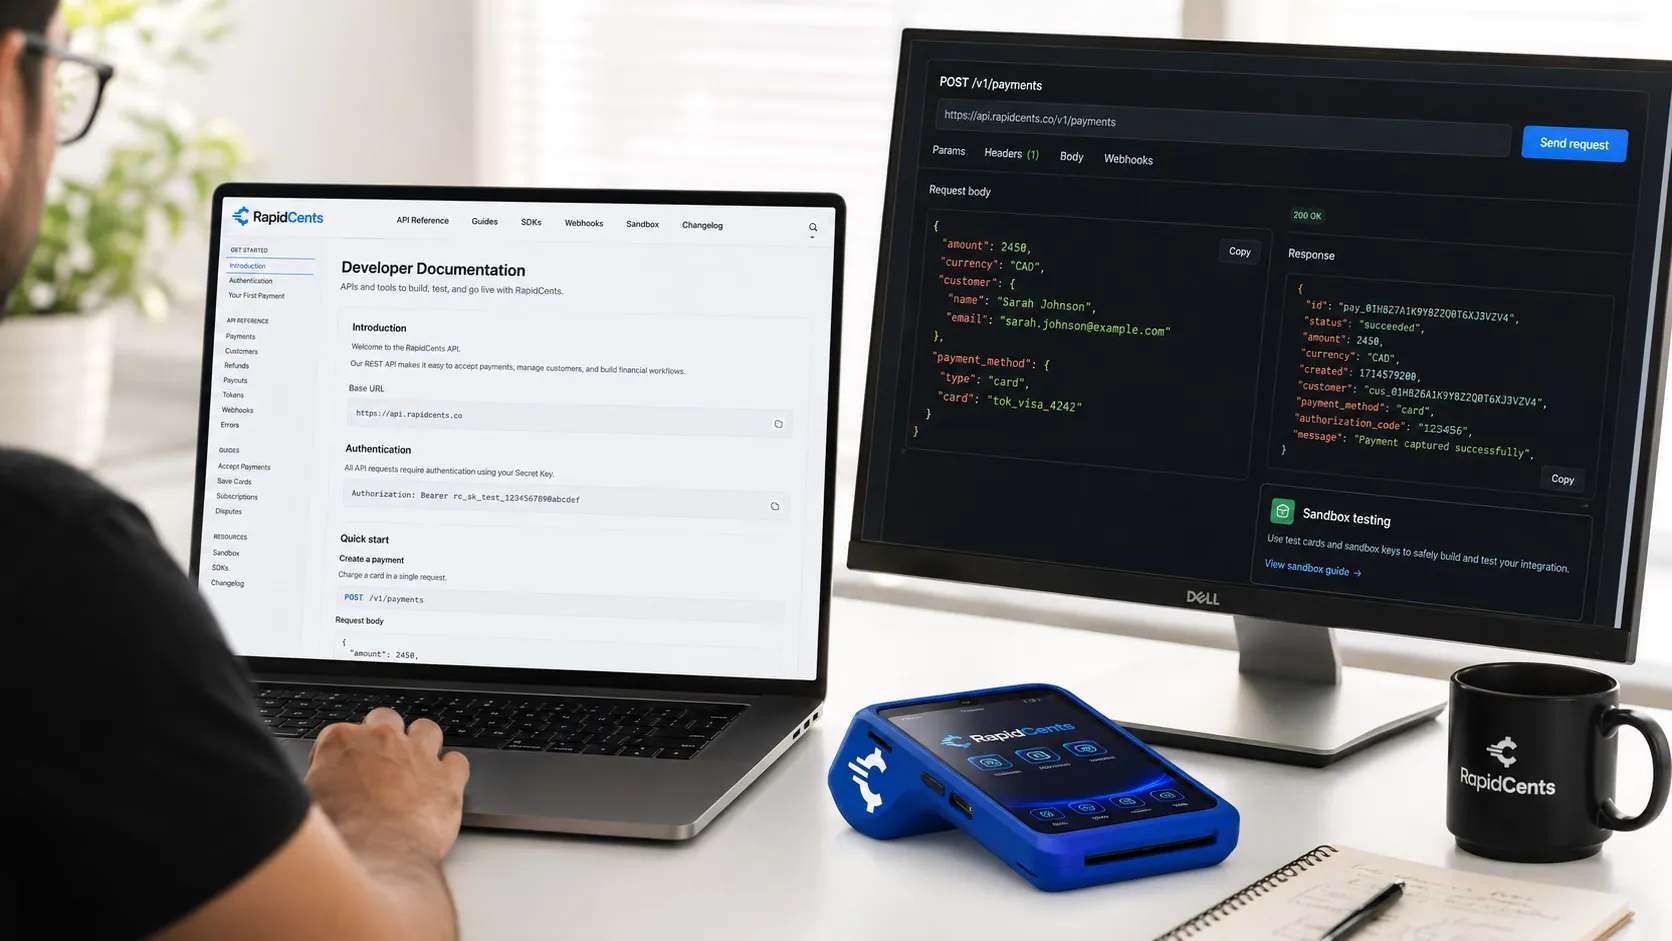
RapidCents developer docs open on a workstation: API reference, a copy-ready example, and a terminal for the in-person path. Documentation
Complete developer documentation for RapidCents payment APIs, webhooks, terminals and sandbox…
Explore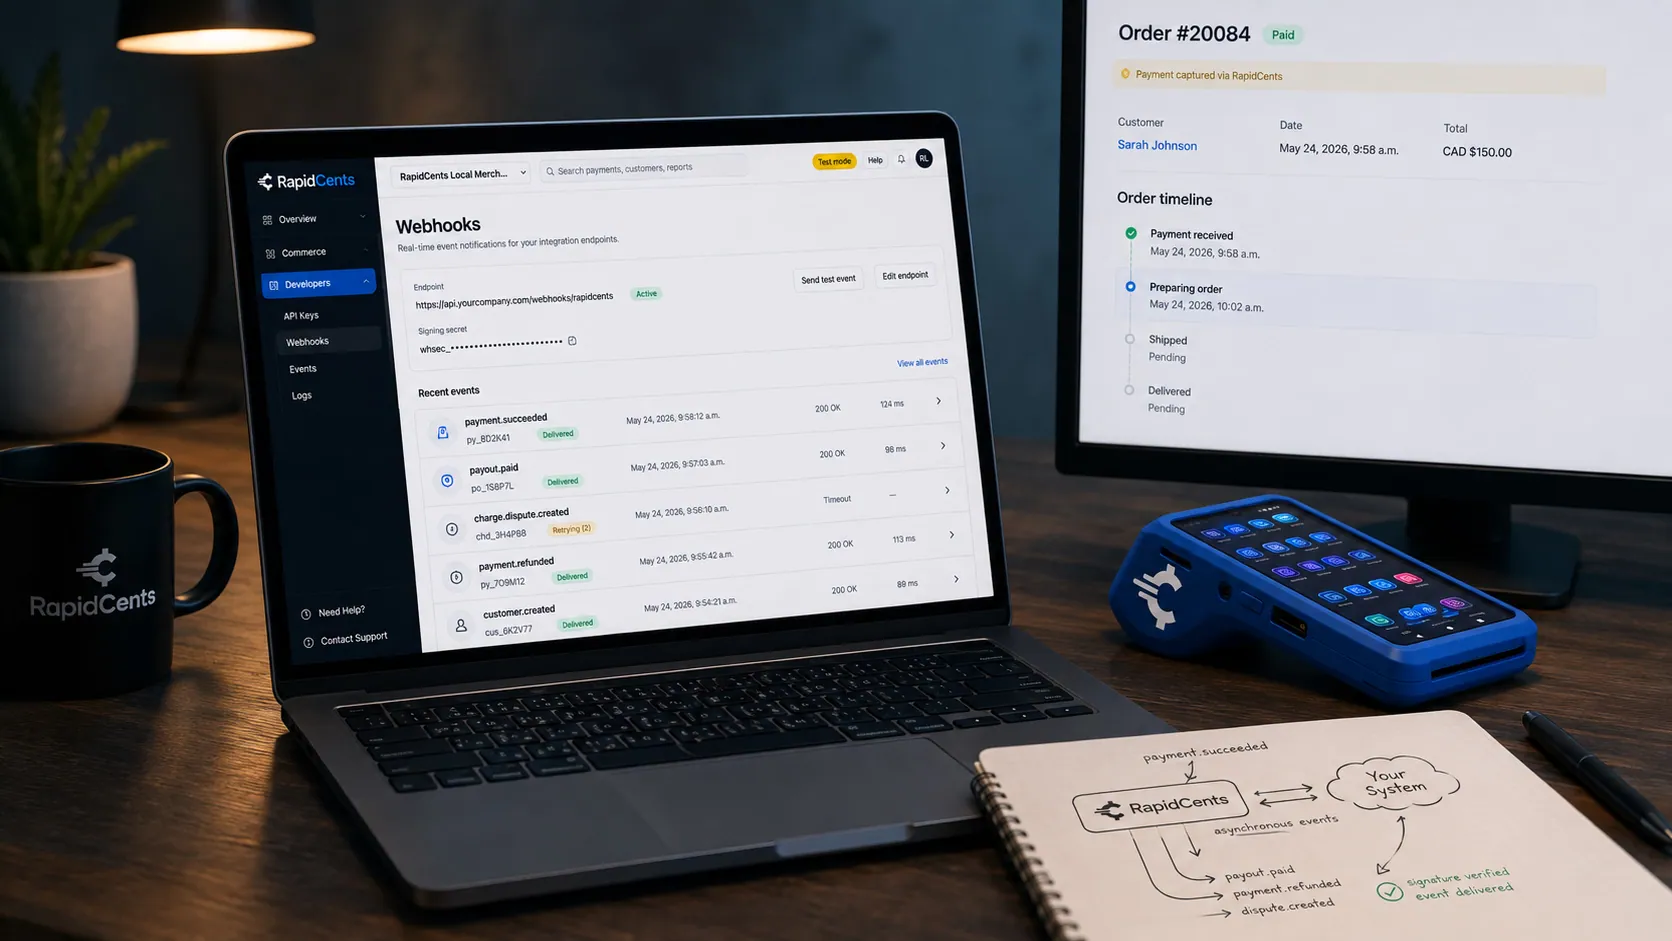
A RapidCents webhook delivery timeline next to the payment that triggered it, with a test terminal on the desk. Webhooks
Signed webhook events for payment lifecycle with idempotent processing guidance.
Explore


Take the next step
Talk to a RapidCents specialist
RapidCents Fee Check reads a processing statement and shows interchange separately from the markup. Upload a statement for an instant breakdown, or open a merchant account and start accepting payments on one account.
- No obligation
- Canadian payment specialists
- Secure statement upload